Tableau
The World's Most Powerful Data Visualisation Platform
Transform your SAP Business One, Salesforce, and operational data into stunning, interactive dashboards with Tableau. ThynkProcess implements and connects Tableau to your live data sources — delivering insights your leadership team will actually use.
Why Tableau for Australian Businesses?
Tableau is the analytics platform of choice when you need to explore complex, multi-source datasets with unmatched visualisation flexibility. Whether you're building executive KPI dashboards, financial variance reports, or supply chain analytics, Tableau's drag-and-drop interface lets your team answer new questions without waiting for IT. ThynkProcess connects Tableau to SAP Business One and Salesforce using optimised, certified connectors — so your dashboards are always on live data.
- SAP B1 Direct Connection: ThynkProcess builds certified Tableau data sources from SAP B1 — financials, inventory, sales, production.
- Salesforce Integration: Combine Salesforce pipeline data with SAP B1 financials for complete revenue analytics.
- Drag-and-Drop Dashboard Builder: Non-technical users can build new charts and views without developer support.
- Mobile-Ready: Tableau dashboards are fully responsive — executives can check KPIs on phones and tablets.
- Tableau Server / Cloud: Share dashboards securely with your organisation on Tableau Server or Tableau Cloud.
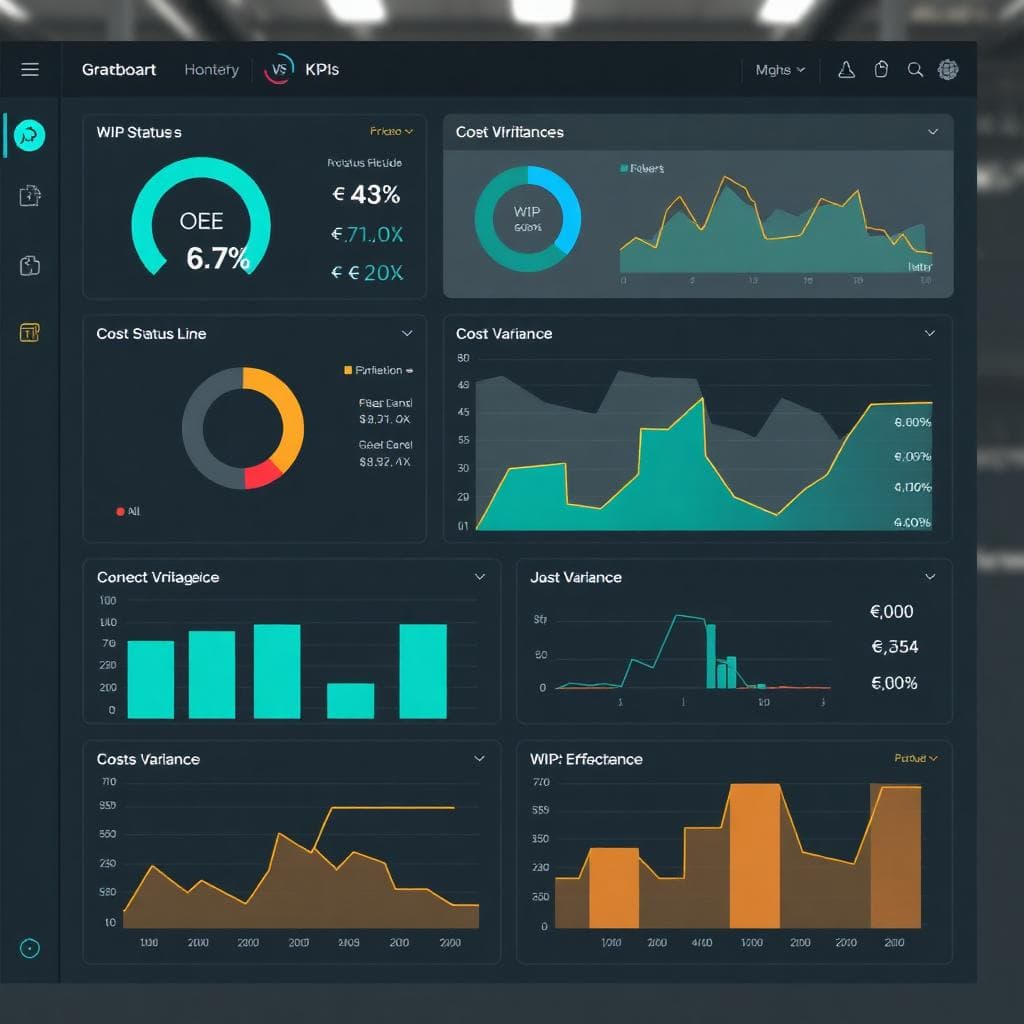
Tableau Capabilities ThynkProcess Delivers
Financial Dashboards
Live P&L, balance sheet, and cash flow dashboards connected to SAP B1 — updated with every transaction.
Inventory Analytics
Stock turn, slow movers, ageing analysis, and supplier scorecards from SAP B1 inventory data.
Sales Performance
Revenue by rep, product, region, and customer — combining Salesforce pipeline with SAP B1 invoicing.
Executive Scorecards
One-page CEO/CFO dashboards with KPI traffic lights, period comparisons, and trend indicators.
Geographic Analysis
Map-based visualisation of customer distribution, sales territory performance, and delivery coverage.
Tableau Server / Cloud
Secure, governed dashboard publishing with row-level security so each user sees only their data.
Common Challenges Tableau Solves
ThynkProcess Tableau Delivery Approach
A ThynkProcess Tableau engagement follows a structured 4-phase delivery that ensures your dashboards are accurate, adopted, and maintainable.
Data Discovery
We audit your SAP B1 and Salesforce data structures, quality, and existing reports.
KPI Workshop
We run a half-day workshop to define the 10–20 metrics most critical to your business leaders.
Data Source Build
We create certified Tableau data sources and extracts from SAP B1 and other systems — optimised for performance.
Dashboard Build
We build, test, and iterate on dashboards with your team over 3–6 sprints.
Training & Handover
Hands-on Tableau training so your team can self-serve new views after go-live.
Tableau Connects To



Is Tableau Right for You?
Industries
Business Size
Key Roles
See Tableau in Action

Ready to See Your SAP and Salesforce Data Come to Life in Tableau?
ThynkProcess builds Tableau analytics solutions connected to your live SAP Business One and Salesforce data. Book a free demo to see what's possible.
+61370753900 | info@thynkprocess.com.au | 39/72 York Street, South Melbourne Victoria 3205